
Packets don’t lie – well, most of the time.
They tell the truth unless they have been captured incorrectly. In those cases, packets can tell bold-faced lies.
When digging through trace files, we can come upon symptoms in the packets that may raise an eyebrow. These are events that look strange on the surface and may even divert our troubleshooting focus for a time. In fact, some of these issues have misdirected engineers for hours, if not days, causing them to chase down issues and events that simply did not exist on the wire.
Most of these examples can be avoided simply by capturing the packets from a tap rather than on the machine generating the traffic. (Come on, you know you have needed a tap for a while! Just spring for one and capture correctly next time.)
- Very large packets
For the most part, packets should not be larger than the Ethernet maximum of 1518 bytes, or whatever the link MTU is set to. That is unless we are using 802.1Q tags or are in a jumbo frame environment.
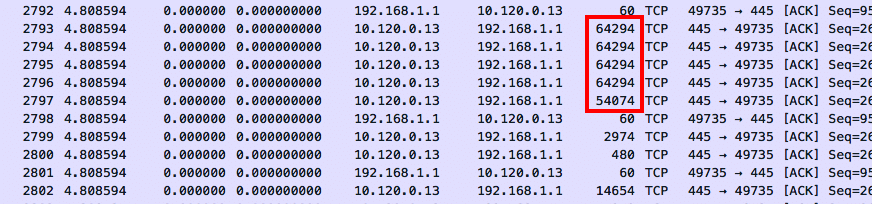
How is it possible to have packets that are larger than the Ethernet maximum? Simply put, we are capturing them before they are broken up by the NIC. Many TCP/IP stacks these days use TCP Segmentation Offloading, which delegates the burden of segmenting the packets to the NIC. The WinPcap or Libpcap driver captures the packets before this process happens, so some of the packets can look far too big to be legal. If the same activity was captured on the wire, the large frames would have been broken into several smaller ones for transport.
- Zero Delta Times
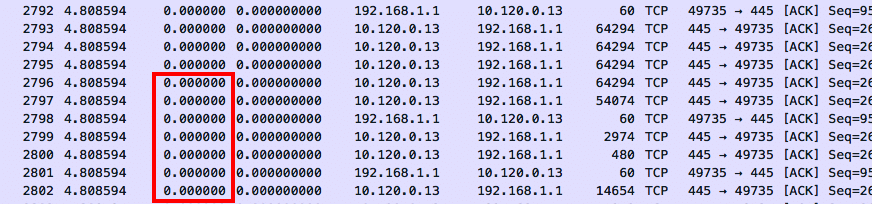
Zero delta times mean that there is no measured time between packets. When these packets entered the capture device, they were timestamped the same as the most recent one with a measureable delta time. The ingress timestamping on the capture device could not keep up with the packet load. If these packets were captured with a tap external to the server, we would likely see correct timestamping.
- Previous Packet Not Captured
This warning is shown because Wireshark interpreted a gap in the TCP stream. It can determine from the sequence numbers that a packet went missing. Sometimes this is legitimately due to upstream packet loss. However, it can also be a symptom that the analyzer or SPAN dropped the packet because it couldn’t keep up with the load.
Hint – after this warning, look for a series of duplicate ACK packets, then an Out-Of-Order packet. This indicates that a packet was indeed lost and needed to be retransmitted. If you don’t see a retransmission or out-of-order packet, then the analyzer or SPAN probably could not keep up with the data stream. The packet was there on the wire, but we didn’t see it.
- TCP ACKed Unseen Segment
In this case, we see an acknowledgement for a data packet that was not captured. The data packet could have taken a different path, or the capture device simply did not pick it up.
Recently, I have seen these events from trace files that have been captured from switches, routers, and firewalls. Since capturing traffic is a lower priority than forwarding (thank goodness!) the device simply missed some of the frames in the stream. Since we saw the acknowledgement, we know that the packet did make it to its destination.
For the most part, packets tell the truth. They can lead us to the root cause of our network and application problems. Since they present such clear and detailed data, it is very important that we capture them as close to the wire as possible. This means capturing them in transit and not on the server itself. This will help us avoid wasting time on the false negatives.