There is a handy new feature in Wireshark 2.6 that just made looking at one of my favorite trace files a little more interesting.
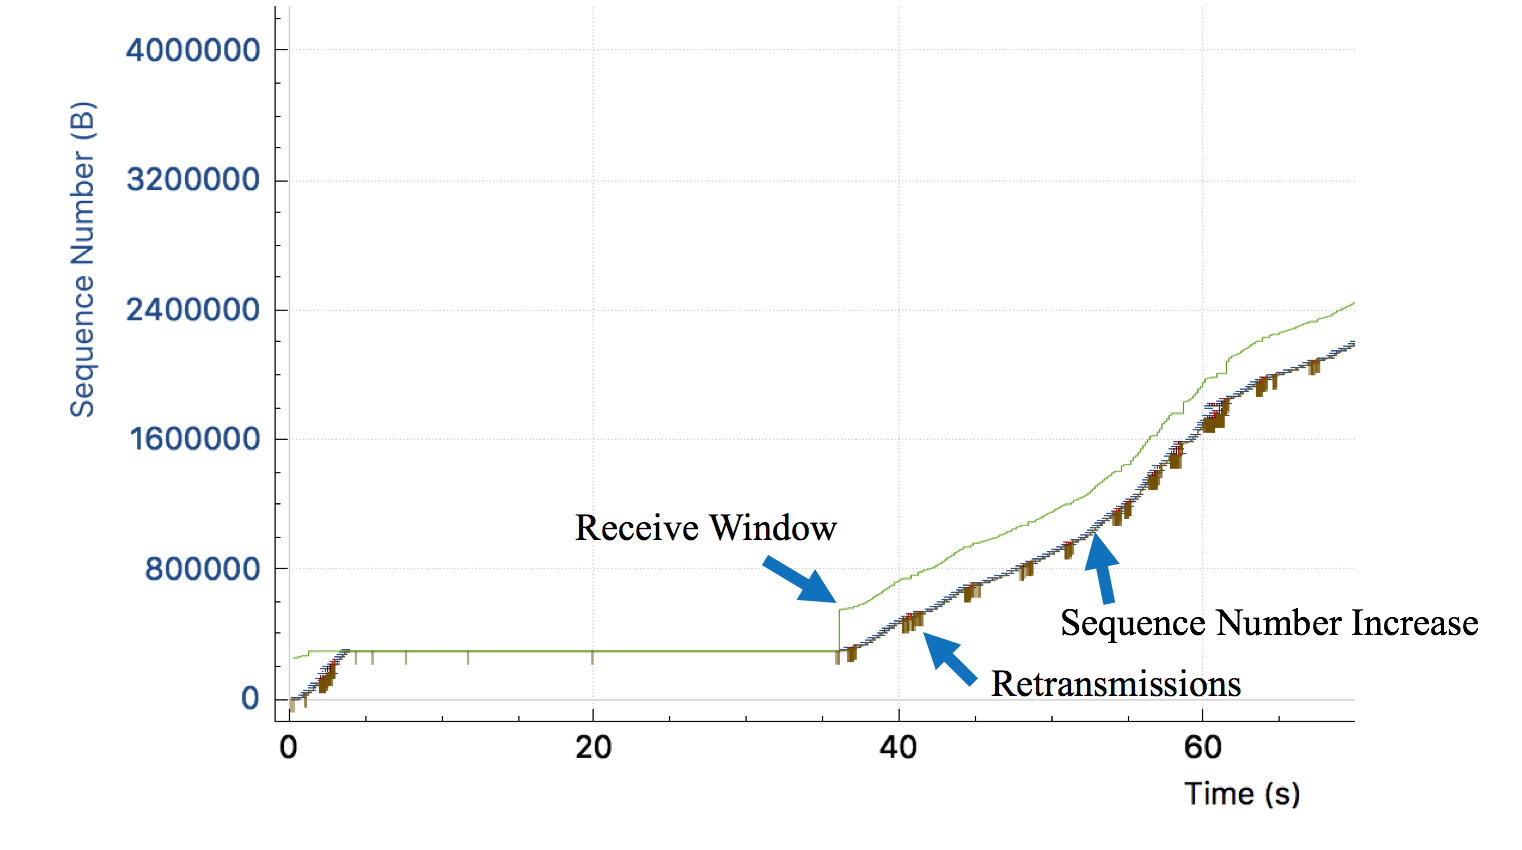
The tcptrace graph has been used by analysts for years to graph the efficiency of data transfers over TCP. It helps us to see sequence number increase over time, the receive TCP window, bytes in flight, retransmissions and acknowledged data. That way if there is a hitch in a download or large transfer, you can quickly spot if the issue and get to digging for root cause.
In the screenshot below we see a tcptrace graph with all the pertinent info.
This graph is great. It has been a huge help for years. As we can see in the graph above, there is a pause for almost 40 seconds in the transfer of data. Now we can start digging.
Until recently, there was one thing missing from the tcptrace graph that is very important to know when analyzing data transfers – zero windows.
When the receiver has a TCP window (or TCP receive buffer as we could call it) that goes to zero, the sender has to pull on the brakes to halt the data transfer. The receiver, in many cases the client side, isn’t keeping up with the ingress data stream and is alerting that the sender needs to stop so it can catch up. This can cause huge problems in data transfers and at times is the root cause of file transfer performance issues.
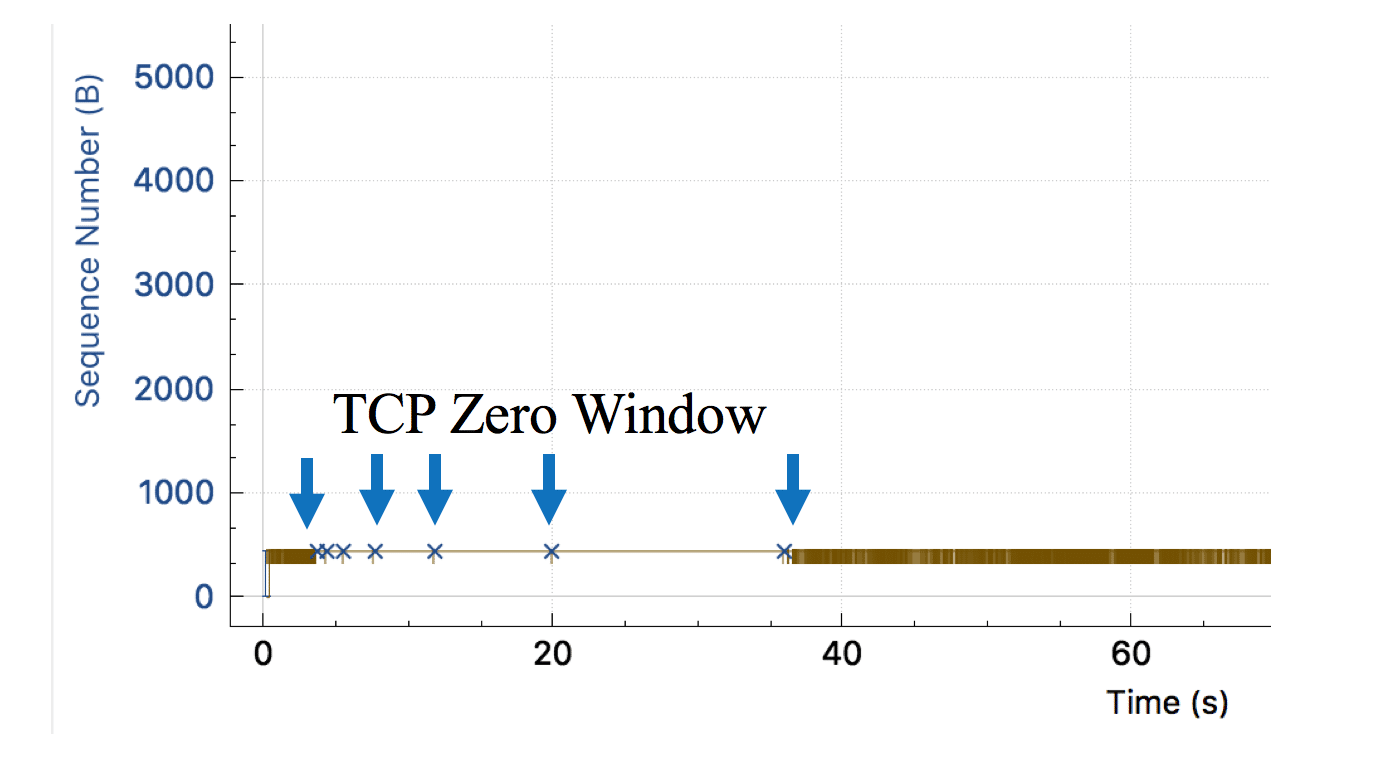
In Wireshark 2.6, now we can see these “halt” packets displayed for us as an X in the stream.
In this file transfer, the client side zero window was a big part of where time was lost. Now using the tcptrace graph, we can spot them more easily.
Thanks Wireshark developers!! This is huge in spotting problems in data transfers. I hope it is helpful to you as well, good reader.
Keep on capturing packet people.


Cool how do you make the graph come up with the x's representing zeros?